
SAGE, the Smarter Academic Graph Explorer, is a search interface for finding academic publications.
Visit SAGE at http://sage-search.appspot.com
Overview
Traditional searches based on browsing lists of keyword search results are not a natural way of searching academic literature. It is difficult for researchers, especially those new to a field, to find the most important papers or to evaluate the importance of a particular paper.
SAGE deals with this by visualizing the citation graph of papers and allowing the user to navigate this graph. The SAGE interface presents search results as a directed graph, with edges between a paper that cites another. We provide easy ways to switch between exploring this graph, skimming the details of a particular paper, and tracking a subset of the papers that the user is interested in. This enables a more natural way of searching the literature, where the user can easily navigate between skimming papers, finding the foundational works which are referenced by those papers, and seeing the relationships between a set of papers that they are interested in.
SAGE was the final project for Princeton COS333 during Spring 2012. It was a collaboration with Brenda Hiller, Lehman Garrison, and Connie Wan.
Implementation Details
Most of this is taken from the submitted project documentation, and as such mentions a lot of low-level/basic details for completeness
Data Source
We use Microsoft Academic Search (MSAS) to access academic papers, and their adjacent papers in the citation graph. Requests from the client are routed through our servers to the MSAS API.
We perform three types of query from Microsoft. Usually, a user session starts with a keyword search, which we pose directly to MSAS. While navigating the results and the surrounding citation network we have to make neighbor queries to find the cited and citing papers for each paper. Finally, we make metadata queries to get the details for each paper, including abstract, authors, keywords, and direct links to the papers.
Unfortunately, this API is extremely slow and has a very low query limit (200/min) which hurts the user experience. We need to make many queries for each user because fetching neighbors of each node necessarily requires a separate query. As such we batch and parallelize our queries as much as possible in order to reduce latency.
Backend
We implemented our backend using Python 2.7 in Google App Engine. The main task of the server is to interpret queries from the frontend interface and then pose them to the data source, and then return the results to the client.
The most interesting part of the backend server is the machinery to deal with asynchronous requests to the MSAS API. We had to do some engineering to optimize our use of the 10 simultaneous queries allowed by AppEngine as well as to minimize client-side latency by combining our queries as much as possible.
Frontend
The frontend of SAGE has a lot of functionality built into it. We make heavy use of jQuery and jQueryUI.
The most interesting part of the frontend is the custom graph layout engine. Because we do not have direct access to the entire citation network, we need a graph layout algorithm that allows dynamic updates of the graph while we fetch additional parts of the citation network. While we originally used a packaged solution, (Arbor.js), we found that the algorithm used (force-directed layout) was not very suitable for our purposes. Complex graphs with many edges were unstable and confusing to interpret.
Our custom graph layout engine is the Dynamic Circle Graph layout (DCG), which was loosely inspired by the chord diagram. In a DCG layout, we focus on one node of a graph and some of its immediate neighbors. We lay out these neighbors in a circle (or oval) around the central node, with some metric sorting them approximately from left to right. In the case of SAGE, we put nodes corresponding to newer publications on the right, so that papers on the right tend to cite papers on the left.
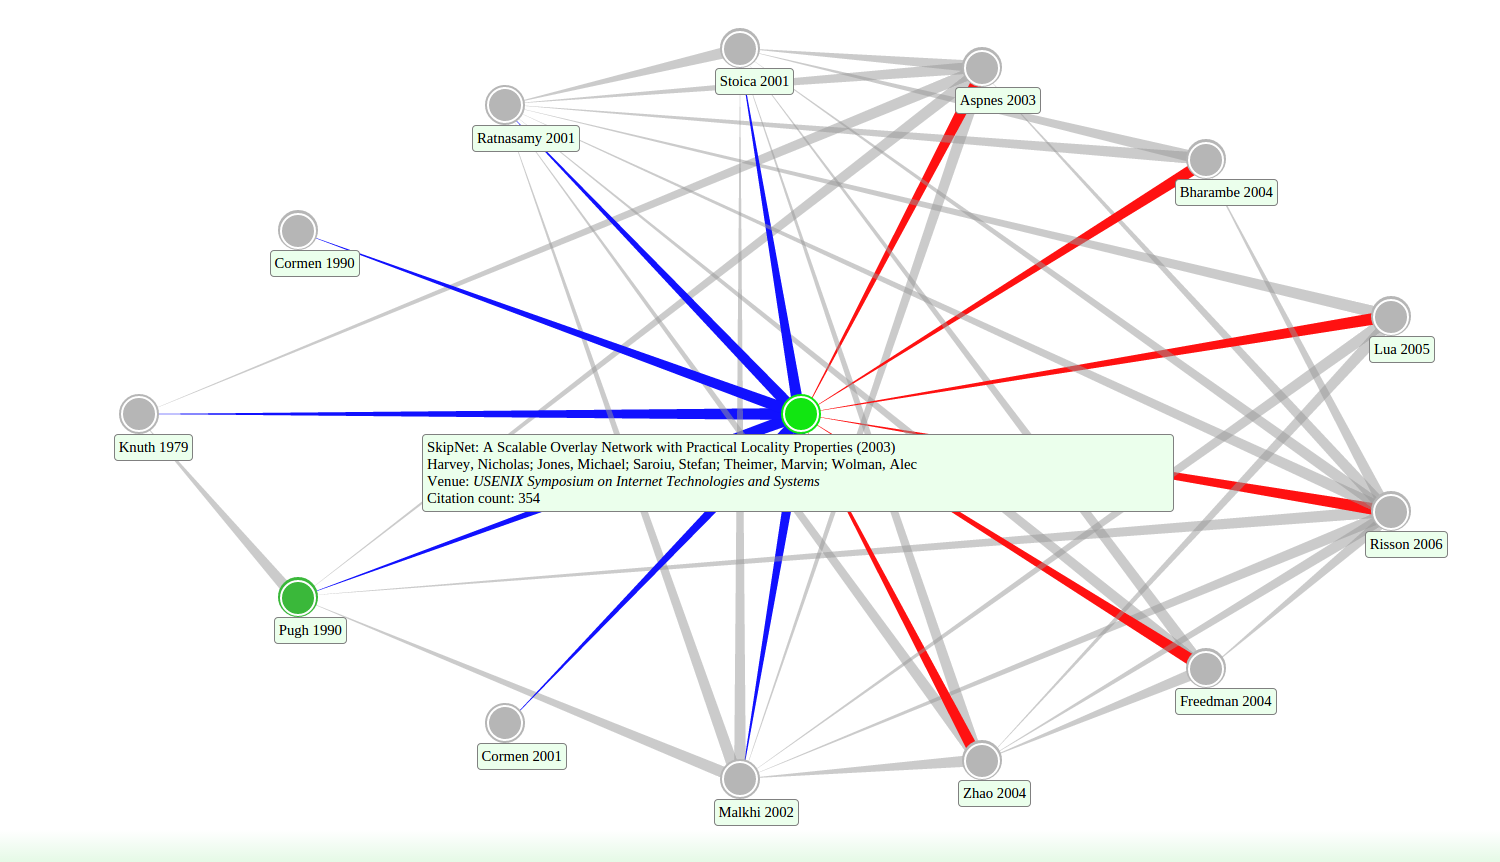
Example of the DCG Layout
The DCG layout has the advantage of being stable in its layout - that is, every time the user revisits a particular neighborhood, it will always appear the same. This is impossible to accomplish in dynamically loaded graph using a force-directed layout; usually using such layout algorithms involves knowing the entire graph structure in advance. Furthermore, regardless of the complexity in graph structure of the displayed nodes, the circular layout makes it easy to see the edge relationships between nodes.
The main downside of the DCG layout is that it is difficult to see larger-scale structure in the citation graph. There is no natural way to extend this beyond the immediate neighbors of the central node while keeping the edge relationships clear. However, given the limitations of our data source, focusing on a single node and its immediate neighbors was a natural way of framing the user interface to allow only those queries we could complete in a reasonable time.
Communication Scheme
- On the client machine, the browser submits a search query from the homepage, issuing a /search request to our server. This is simply a GET HTML request with the query parameter in the url.
- On Google App Engine, the server renders a search result page that loads all of our javascript (but does not yet have any results) onto the client machine.
- On the client machine, once the page is completed loading, our code issues an asynchronous query to our server requesting the raw results for the search query (/fulltext). This is a POST HTML request.
- On Google App Engine, our server makes the full-text search query to Microsoft with the same text it was passed. Since we have no databases or systems of our own, we only need to perform rudimentary sanitization of input, relying on the robustness of Microsoft's server to handle any malicious attacks.
- Microsoft's database returns to us a list of results in JSON form. We request only a small number of the top results (currently 10).
- On Google App Engine, for each of these results, we issue a request for a list of all references in parallel. This involves sending Microsoft the specific ID of the paper that we wish to retrieve references for. We request all the references in order to ensure that the graph rendered by the client will be complete. We then combine the references into the search results and return a list of article objects in JSON form. Note that we only have the full information (title, author, year, etc.) for the primary search results - the set of neighbors for each result is only a list of IDs.
- On the client side, the JSON objects with complete reference (i.e. outedge) information is decoded and saved into the graph structure. Although not all neighbors of a node may be populated, having the full graph structure means that newly loaded nodes will still be correctly connected to existing nodes.
- On the client side, when the user clicks on a node that has not yet had its neighbors loaded, our code issues a request to our SAGE server (/neighbors) requesting neighbors of the node with the specified ID.
- On Google App Engine, we issue a request to Microsoft for the top neighbors of the requested article (not all of the neighbors).
- Microsoft's database returns to us the full information for these neighbors in JSON form.
- On Google App Engine, as with the search query we parallelize requests for the full reference list (by ID) of each of these results, combine the neighbor information with the article data, and return it to the client.